What changed in Japan’s Android app market over the past ten years? According to the ten-year app market report Fuller published on 12 November 2026, the number of apps one person opens in a month rose from 22.6 in June 2016 to 49.3 in June 2026. Of the 100 apps with the most monthly users in June 2026, only 27 were also in the top 100 a decade earlier. The other 73 arrived in between.
Japan is often described as an iPhone market, but by handset ownership Android is the larger side. MMD Labo’s August 2026 survey, which counted the main phone of 34,838 people, put Android at 54.1% and iPhone at 45.6%. This article looks at what changed on that Android side.
Japanese Android users open twice as many apps as they did in 2016
Fuller’s ten-year report tracks apps opened per user per month, measured each June.
| Month | Apps opened per user |
|---|---|
| June 2016 | 22.6 |
| June 2023 | 43.7 (first time above 40) |
| June 2026 | 49.3 |
Fuller, “10-Year App Market Report,” 12 November 2026. Japan, Android.
The count first passed 40 in June 2023 and has stayed in the forties since. In its 2026 Q3 report, published two days earlier on 10 November 2026, Fuller put the July to September figure at 50.5 apps per user per month, with daily smartphone time at 5 hours 51 minutes, up 11.4% year on year. The two figures cover different windows, one month against one quarter, so they cannot be chained into a growth rate.
One distinction matters here. The 49.3 figure counts apps actually opened during the month, not apps installed and left alone. That makes a common assumption, that there is no room left on a Japanese user’s phone, worth re-checking on Android. The number of apps people actually use is twice what it was ten years ago.
Where did the new app slots go?
Fuller groups Google Play categories into twelve buckets and tracks how apps opened per user are spread across them.
| Share of apps opened per user | June 2016 | June 2026 |
|---|---|---|
| Shopping and lifestyle, plus finance | 10.9% | 32.2% |
Fuller, “10-Year App Market Report,” 12 November 2026. Japan, Android.
Ten years ago roughly one in ten apps a person opened was shopping, lifestyle or finance. Today it is close to one in three.
How much did the top 100 change?
Comparing the 100 apps with the most monthly users in June 2026 against the same list from June 2016, 27 apps held their place and 73 were replaced. Broken down by category, the new arrivals land like this.
| Top 100 by monthly users, June 2026 | Apps | Absent from the June 2016 top 100 |
|---|---|---|
| All categories | 100 | 73 |
| Shopping and lifestyle | 27 | 21 |
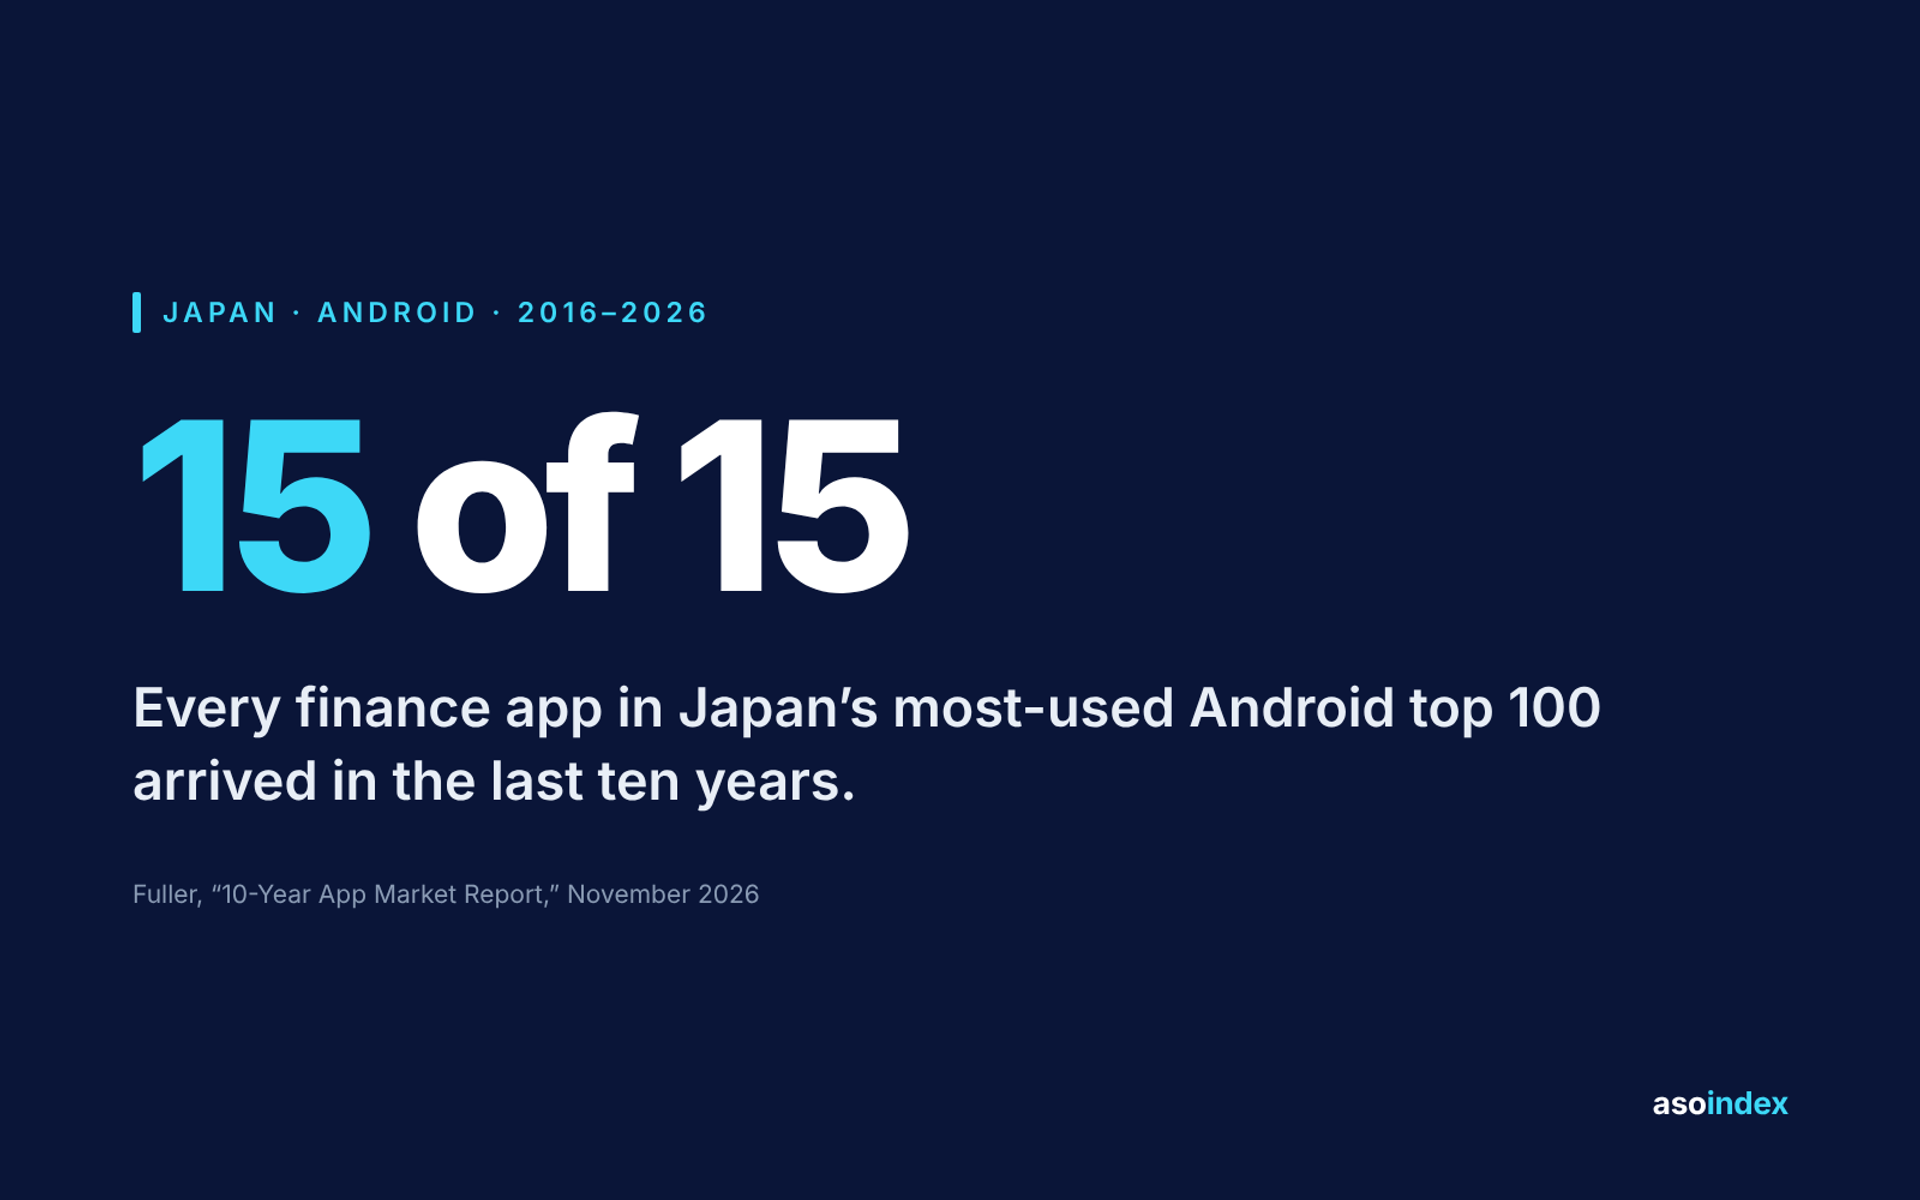
| Finance | 15 | 15, all of them |
Fuller, “10-Year App Market Report,” 12 November 2026. Japan, Android.
Finance is the sharpest case. All 15 of its apps in the June 2026 top 100 were absent from the June 2016 list, so an entire category turned over. Shopping and lifestyle is close behind, with 21 of its 27 apps new.
Fuller also reports the two categories combined: the number of shopping, lifestyle and finance apps inside the top 100 grew from 12 in June 2016 to 42 in June 2026. That points the same way as the usage share above. The app slots that opened up in Japan on Android over the decade went to everyday commerce and money rather than to games or social, and most of the apps holding those slots arrived within the decade.
This is not only a ten-year pattern
In the Japanese Google Play top 30 by free downloads that asoindex records each week, 10 of the 30 apps changed between 9 November and 16 November 2026.
These two numbers measure different things and should not be added or compared. Fuller counts the 100 apps with the most monthly users; our chart counts the top 30 by free downloads. One tracks how much an app is used, the other how often it is installed. Each is read on its own terms.
What to change when you look at Japan on Android
- Do not build the competitive set out of ten-year-old names. The apps that come to mind for Japan tend to be the ones that have held their position longest, but 73 of today’s 100 most-used apps arrived after 2016. Count what is actually being used in the category now.
- Do not judge a category by games and social. The growth in usage share went to shopping, lifestyle and finance, and the number of those apps inside the top 100 went from 12 to 42. How much of a category is less than a decade old varies a great deal.
- Check the saturation assumption against the number. Entering a market where a person opens 22.6 apps a month is not the same problem as entering one where they open 49.3.
- Do not treat Android and iOS as one market. Every figure here comes from an Android panel. Whether the same thing happened on iOS in Japan cannot be answered with this data.
Summary
- Fuller’s ten-year app market report, published in November 2026, puts apps opened per user per month in Japan at 22.6 in June 2016 and 49.3 in June 2026.
- The combined share of shopping, lifestyle and finance apps in that count rose from 10.9% to 32.2% over the same period.
- Of the 100 apps with the most monthly users, 73 were replaced in ten years, and all 15 finance apps in the current top 100 are new.
- The number of shopping, lifestyle and finance apps inside the top 100 grew from 12 to 42.
- Japan on Android reads less like a market with no room left and more like one where the room grew while the occupants changed.
Looking at the Korean or Japanese app market? asoindex reads the app store data from both markets every week.